Pie charts are the best way to visualize information. The ratio of all data to each other is clear from such a chart. A contrasting image is easiest for any audience to perceive. Those who have already tried to create them know that there are many difficulties that can be encountered.
However, mobile apps greatly simplify the whole process. Thus, we have reviewed the best pie chart makers for Android & iOS among which you can choose the best option.
If you prefer to save files in PDF format then we recommend you these best PDF editor apps for Android & iOS.
Pie Chart

The Pie Chart app provides a great way to visualize large amounts of data. Create, edit, and format in a way that you can understand. The whole process will take you only a few minutes.
This program is perfect for running your personal deals as well as for productive business management.
All the controls here are intuitive. It is easy to use the app, considering the peculiarities of creating diagrams on mobile platforms.
You can choose an individual color for each part. Charts are available for saving and further editing. They can also be copied for use in other services.
If you want to import data, do it through CSV or CHART files. Values can be adjusted by dragging and dropping them.
Directly from the app, you can share data via email or messengers. This app is free and does not contain annoying ads.
There are some limitations that you can get rid of by buying a paid subscription. But they do not affect the performance in any way, so most users use the functionality that is available for free.
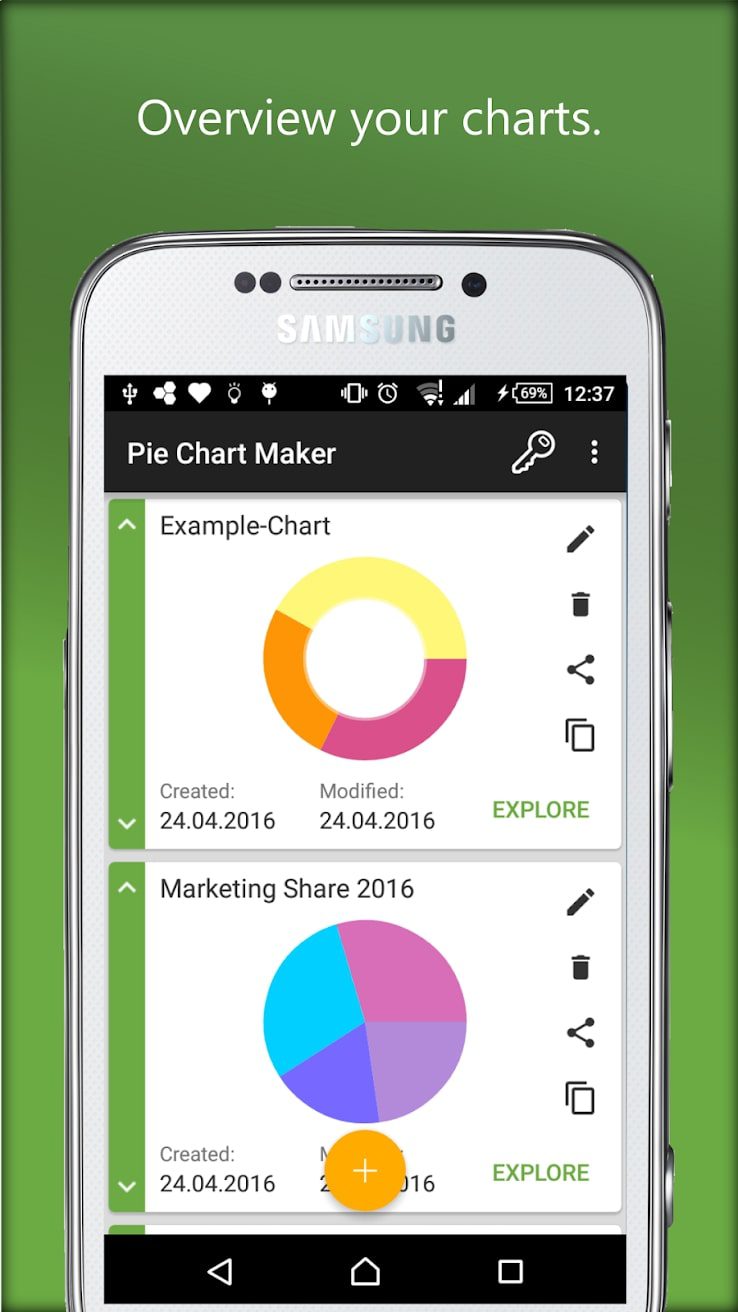
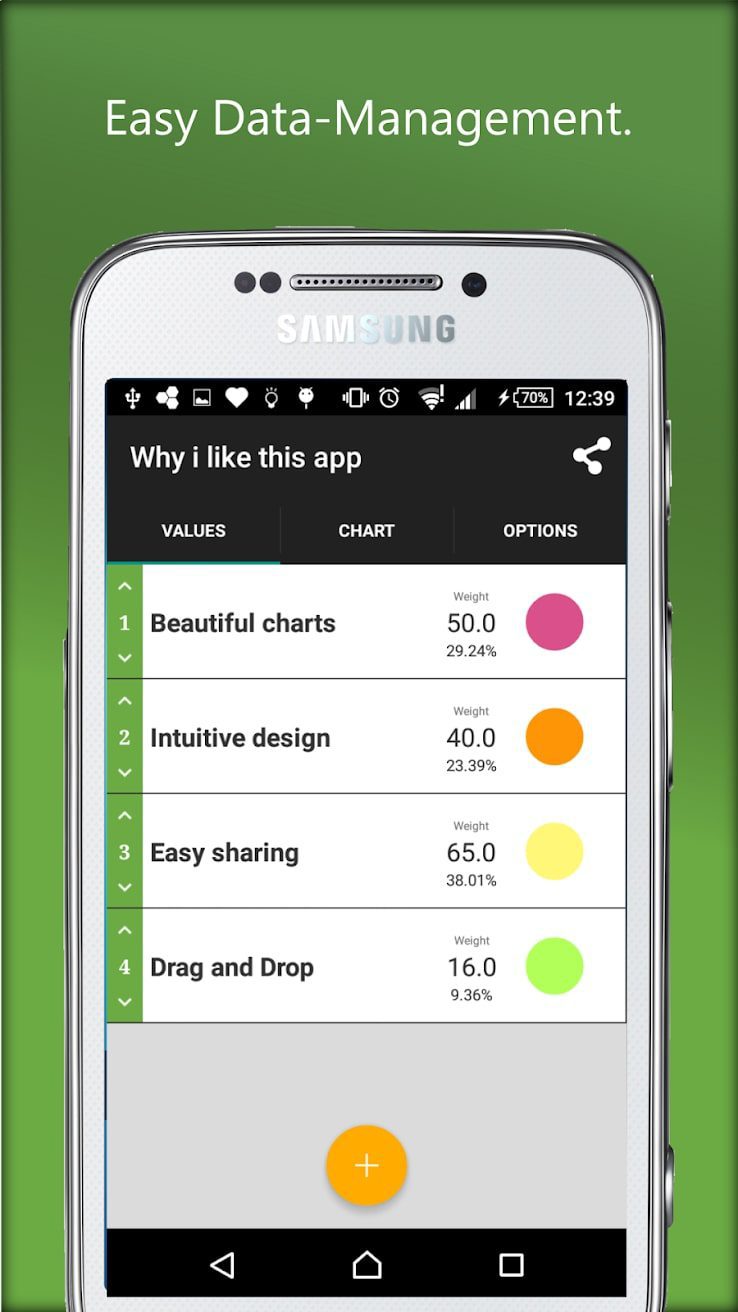
It’s also worth noting that you can contact the app support if you miss any features. This team is responsive and considers the opinion of every user.

You may also like: 9 Best Scrum Project Management Apps for Android & iOS
GraPho
Create everything from line graphs to pie charts. Three types are available. To build them, you only need to enter the data.
The app will help to display the results of a survey or questionnaire. It is possible to share them with friends in a few seconds. The finished images are automatically saved in the gallery.
You need to choose a name for each graphic. Already created images can be edited, deleted, or just viewed. Working in the app is intuitive.
First, you have to select the type of graph. Then enter a name and known data. The image will be ready in a few moments.
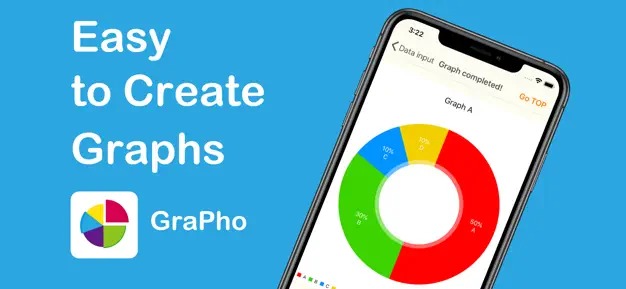
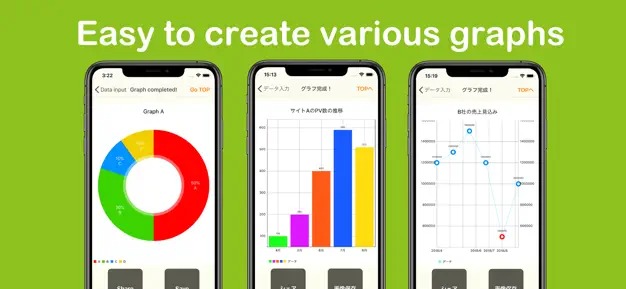
The graph can be modified or edited at any time. All data is saved in the cloud storage.

PieChart Maker

With PieChart Maker you will have all the tools you need.
The charts are easy to visualize in a proper format. Also, you are to edit them.
For previewing you can adjust the parameters. Save the result in the gallery of the device. This will allow you to edit it later.
You can also export the finished graph to Excel format.
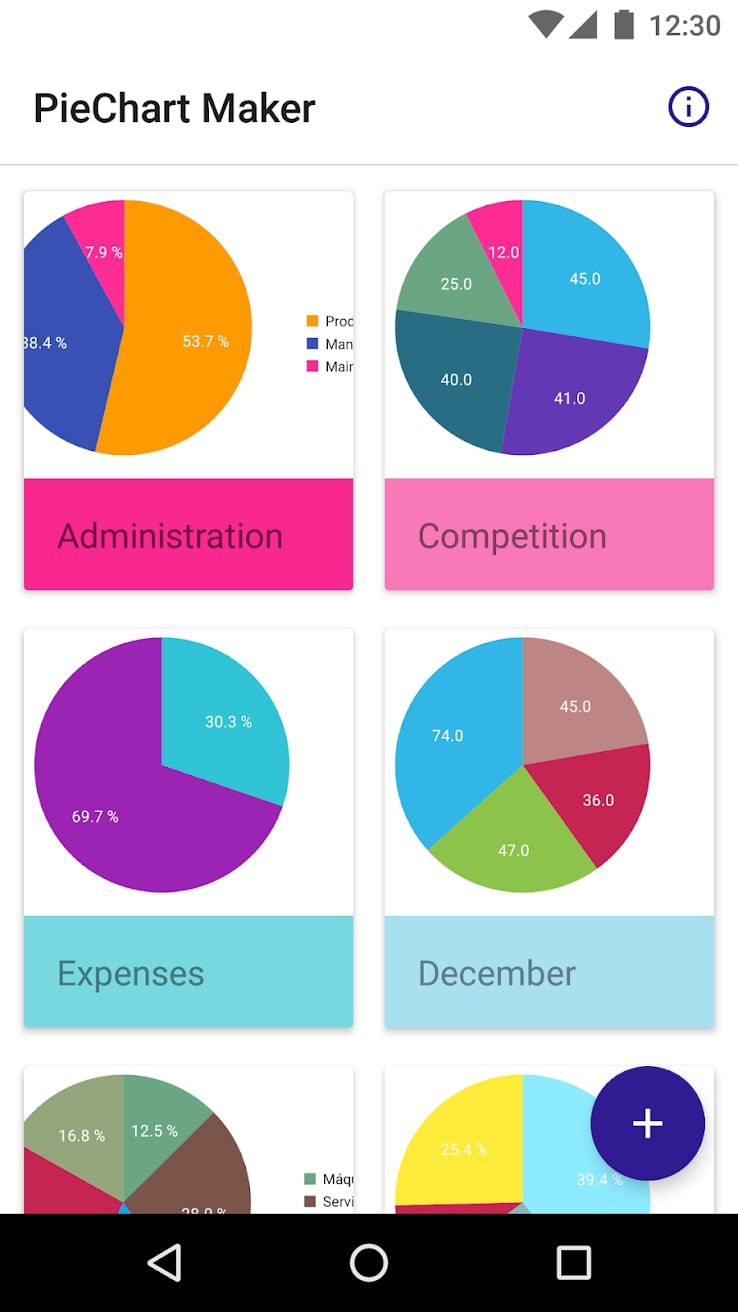
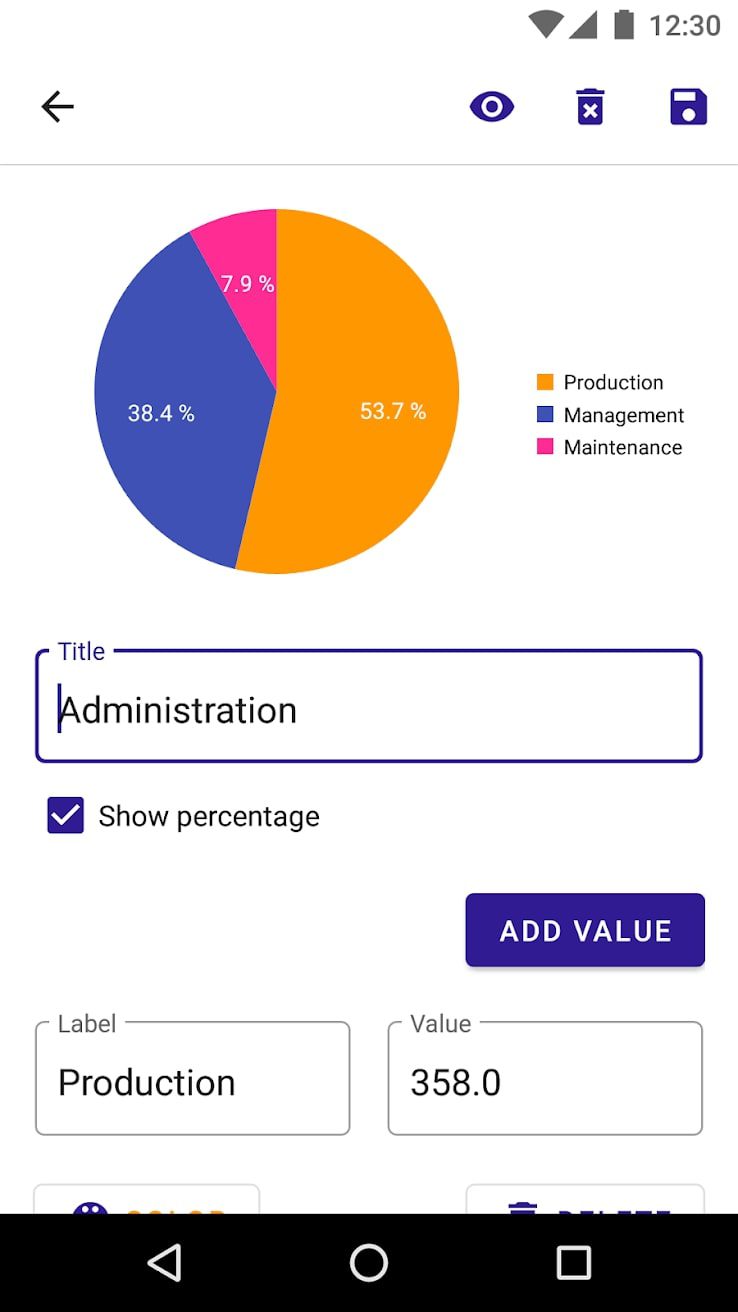
This app is free and has high user ratings.

Pie Chart 3D Free
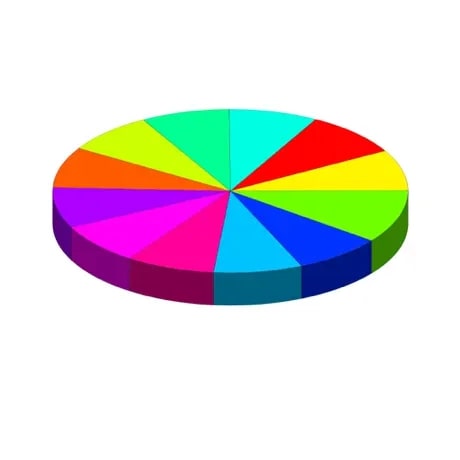
App for creating pie charts in a matter of moments and a few taps. It can be saved in the app, phone memory, or sent to e-mail.
A book mode is available on the tablet to show the audience during the presentation. You can add new slices, move division lines, and change the size of a single slice.
It takes one motion to change the size and location. The date and name of the graph remain when saving. Cloud storage of up to fifteen images is available. Unnecessary graphics are subject to deletion.
There is a free trial version. The premium version is suitable for creating a maximum of five divisions on a pie chart. Only one can be saved. The color of the division is selected from the palette.
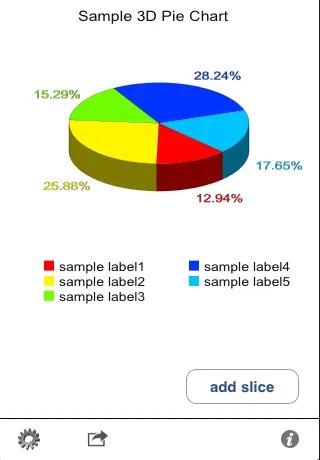
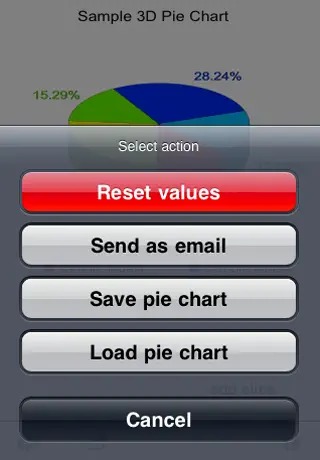
The app is easy to use. It will be invaluable for creating a scientific publication or presentation.

Chart Maker
In Chart Maker you will find a variety of great options. They will display data that you enter manually.
All diagrams are saved in the gallery of the app or your phone. Subsequently, they will be available for editing.
This program has the most advanced interface. At the same time, all its elements and functions remain understandable even for beginners.
The created graphics can also be saved in PDF and PNG format. You can print them out using a special section. It is also possible to share the result with your friends.
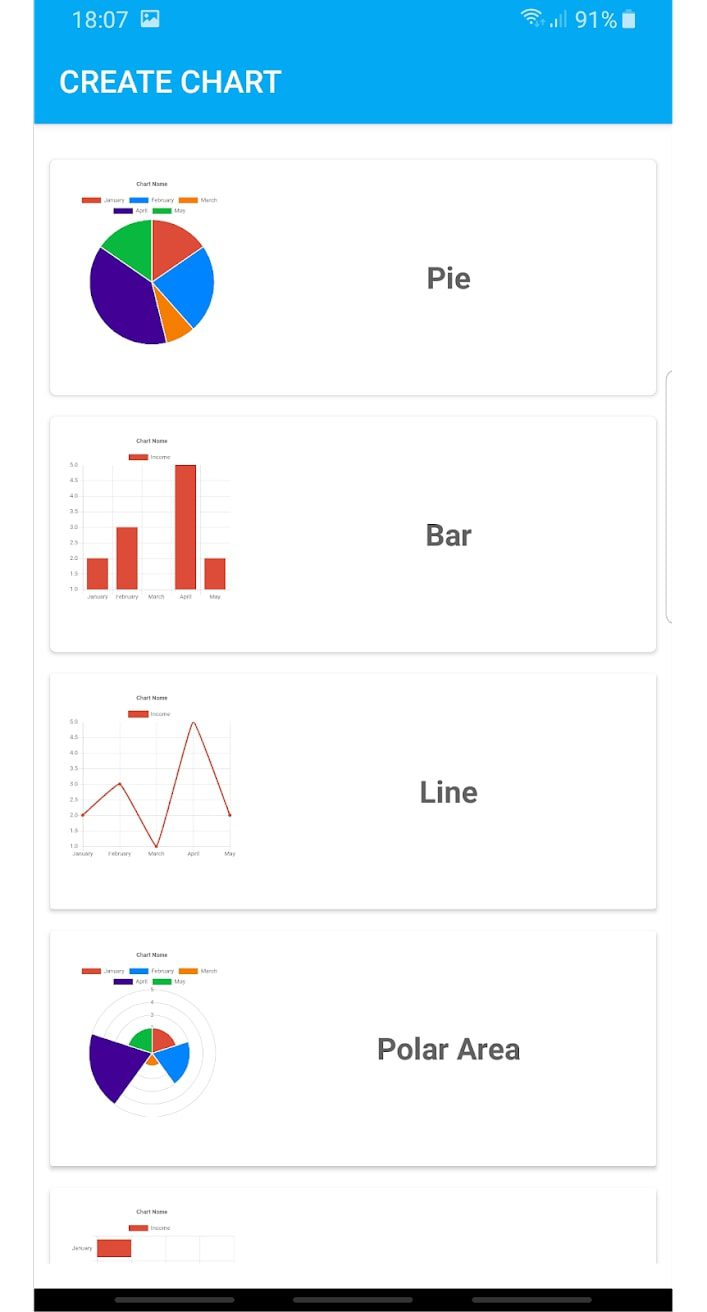
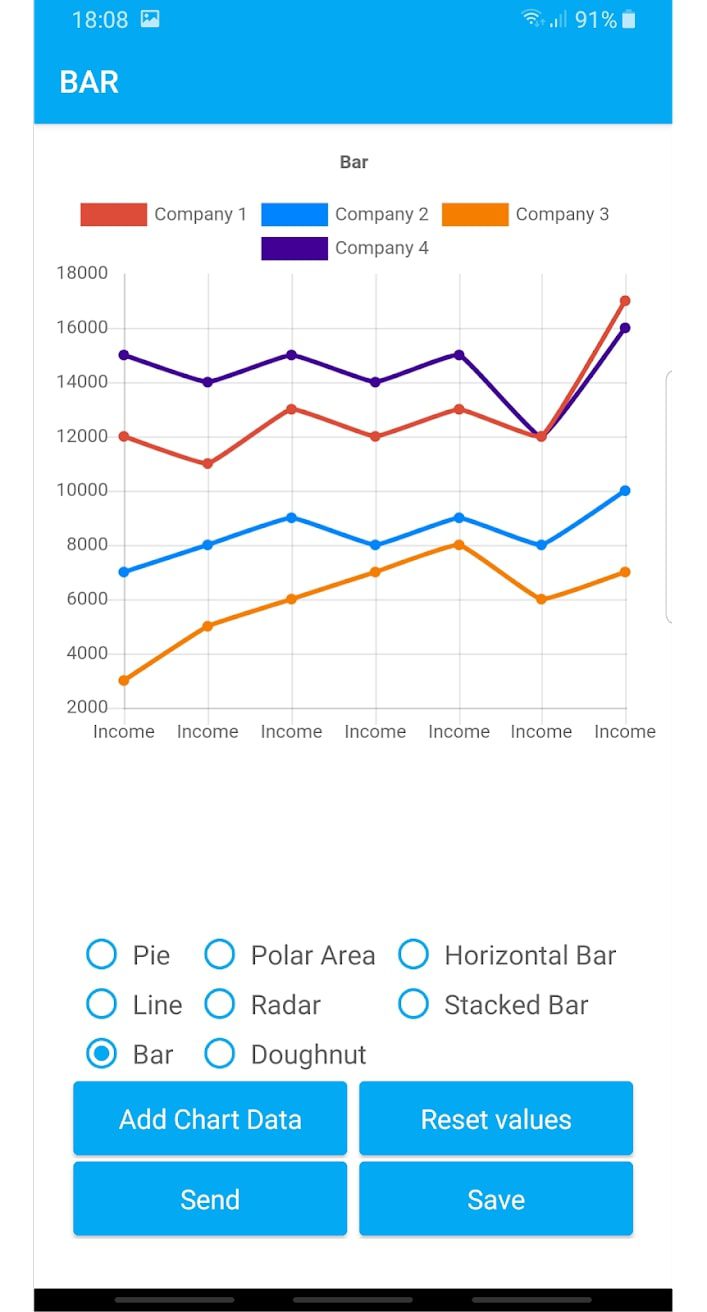
There are many types available here. You can use horizontal, vertical, linear, pie, and so on. All in all, it’s a great app for charting information.

Chartie

The Chartie app allows you to create beautiful pie charts in just a few steps. Enter data using the support of clean UI.
All of the parts can be edited by selecting the appropriate color. Doughnut and bar charts are available for more visualization.
You can customize the data so that the final result is fully understandable to you. All data is available for saving in PNG format.
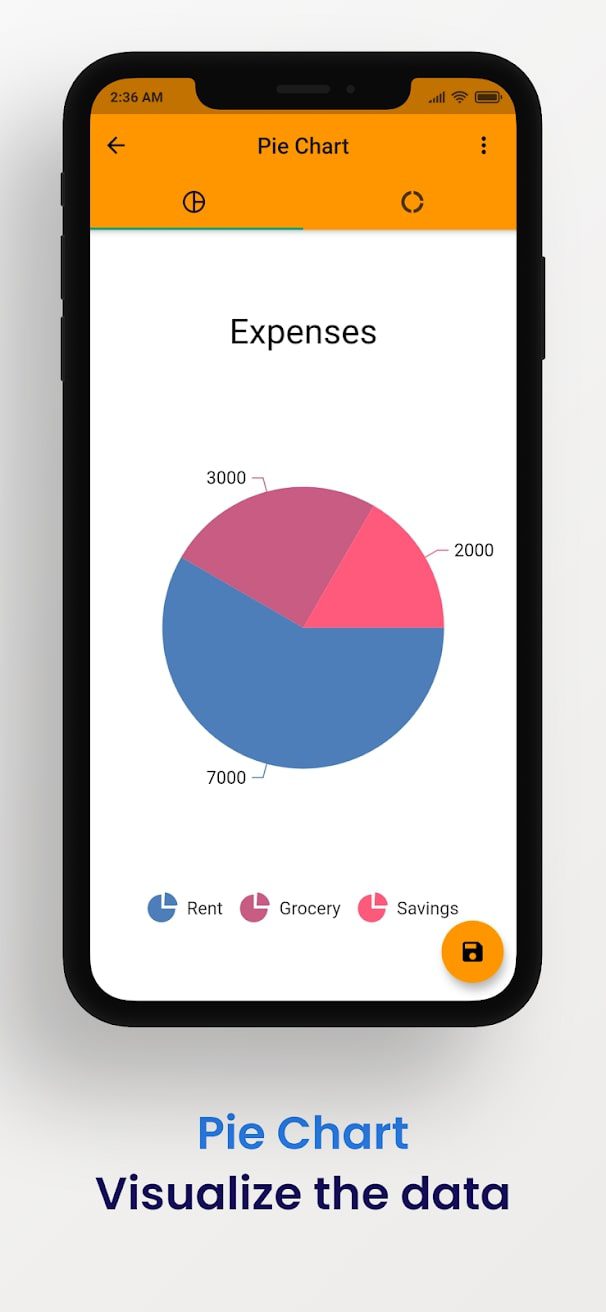
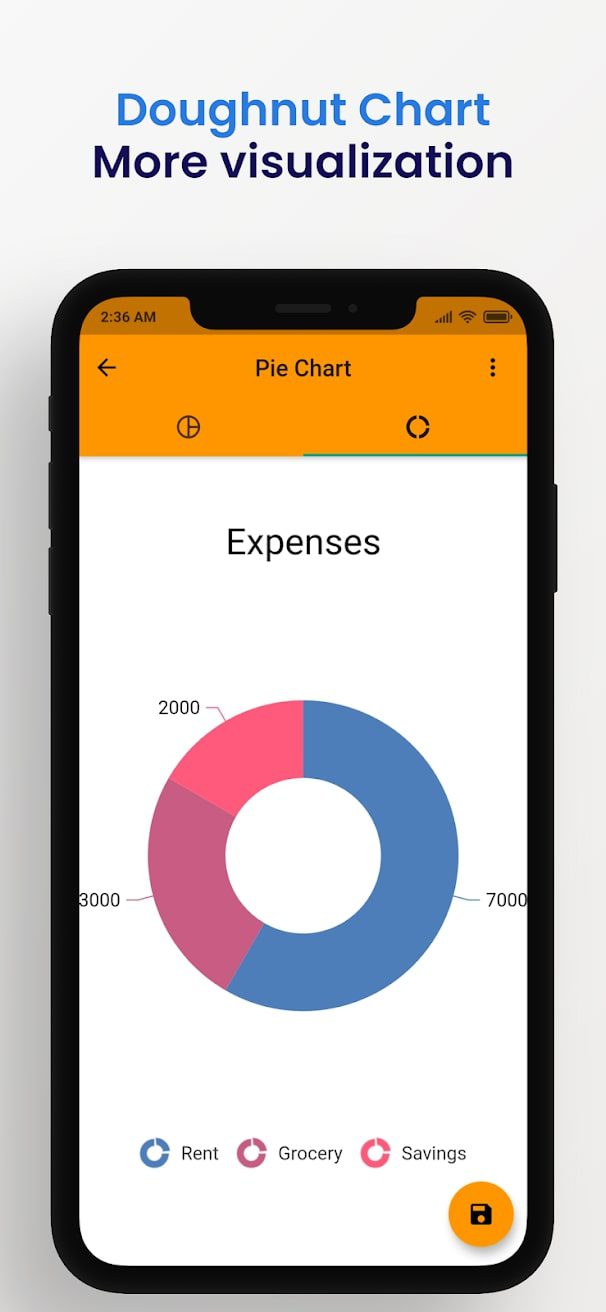
This app is great for designing large projects. The abovementioned customizations make this program really worth your attention.

Chart Maker Pro

This is a great tool for converting any information into charts and graphs. The interface is user-friendly, which pleases all users.
To start with, enter all the data into a table. Then the program will create a chart for you. There are histograms, lines, and pie options.
The app stores the created ones and gives the possibility to edit them later. For example, you can change the type, enter new data or change the color.
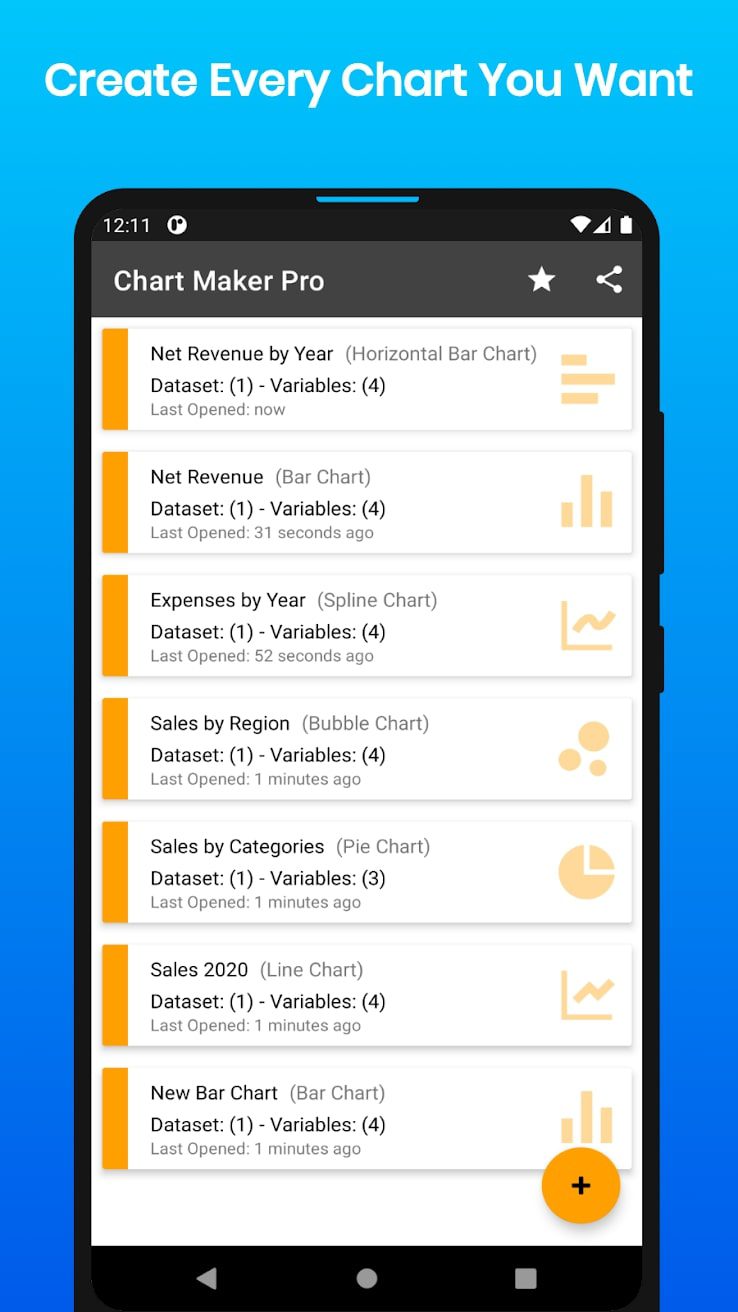
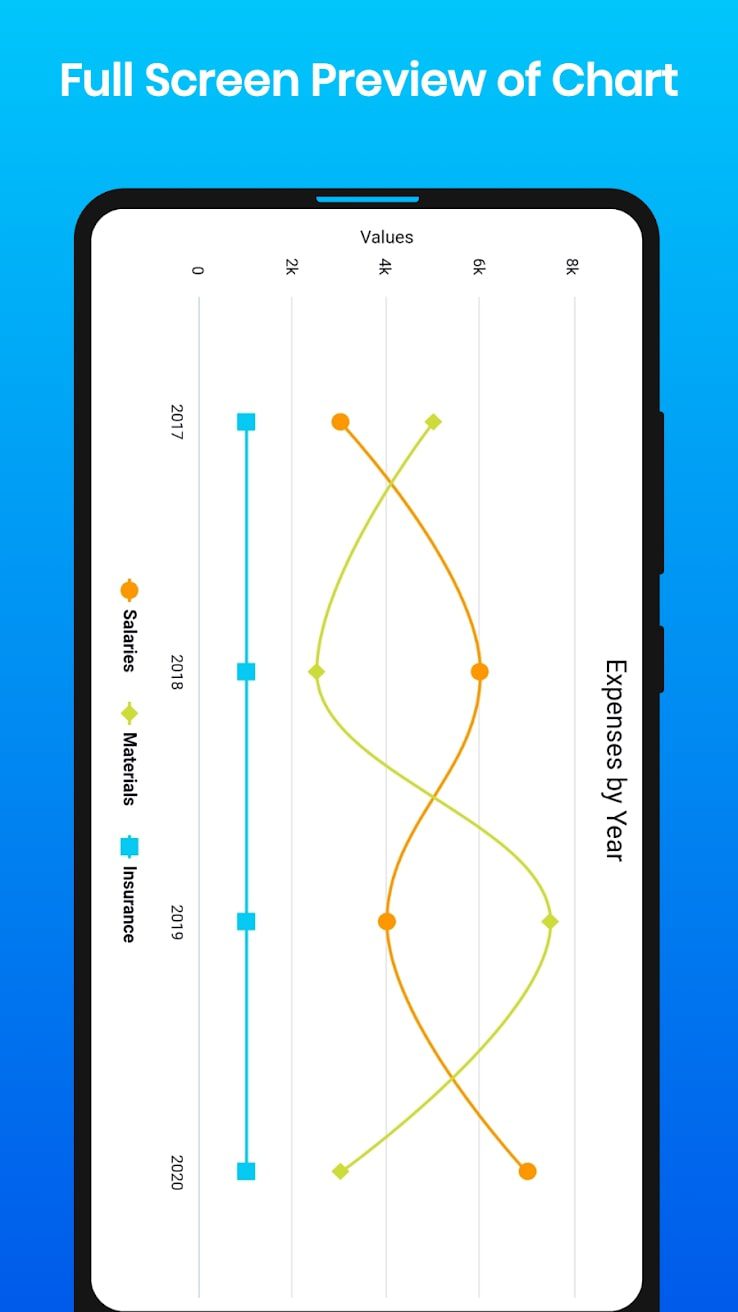
Thanks to advanced tools you can also take a screenshot and send it to your friends.

You may also like: 11 Free JPG to PDF Apps for Android & iOS
Graph Maker
Graph Maker is an app with a huge variety of types, including pie charts. It takes you a few minutes to clearly visualize all the data.
In addition to basic options, you can also use them for business reporting. The design of the app is intuitive. All the features you need for a great result are available in the app.
There are completely no advertisements of any kind. This allows you to not be distracted from the main process of work.
From the available types, we would like to highlight pie, bubble, and bar. The other options are standard. For each type of data, you can choose the color you prefer. The annotations can be customized.
It is also available for labeling values and axes. You can add bounding lines to all diagrams. The color of the text is optional, you can adjust its size too. All changes can be viewed in a special window. Data import and export are available through CHART and CSV files. They can also be copied.
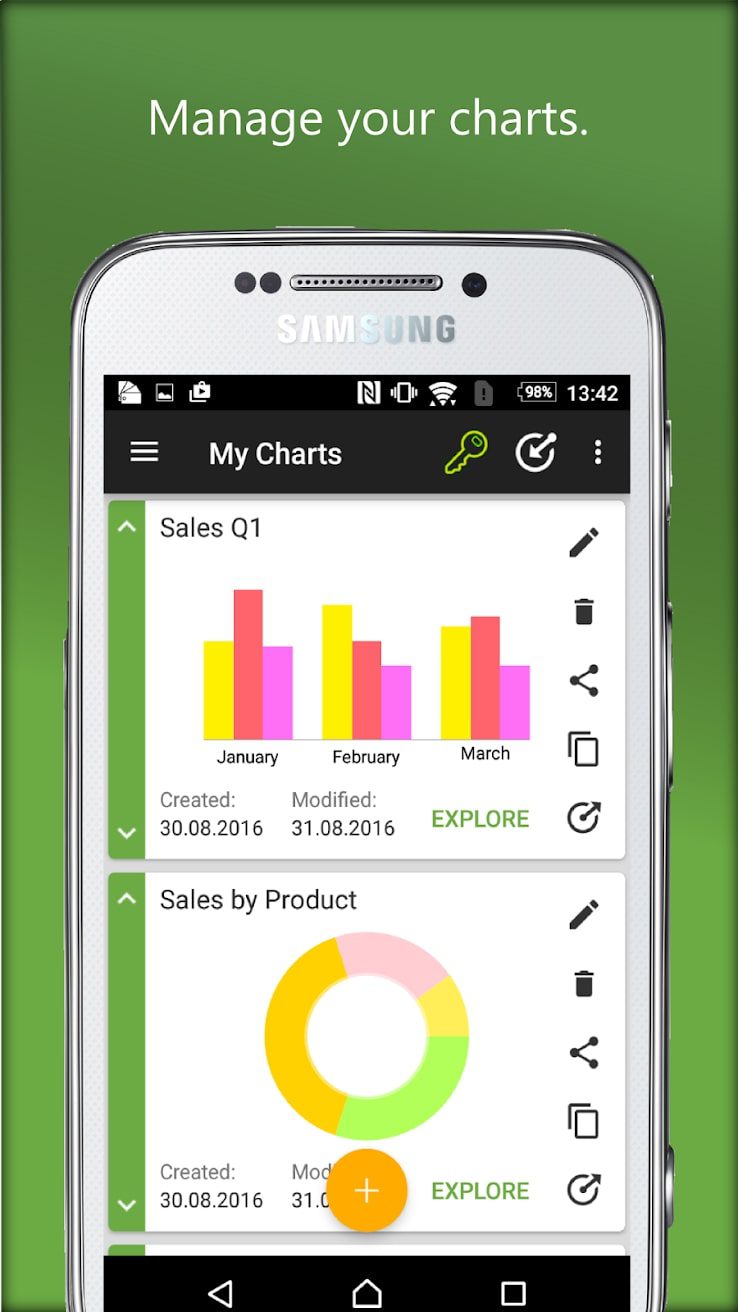
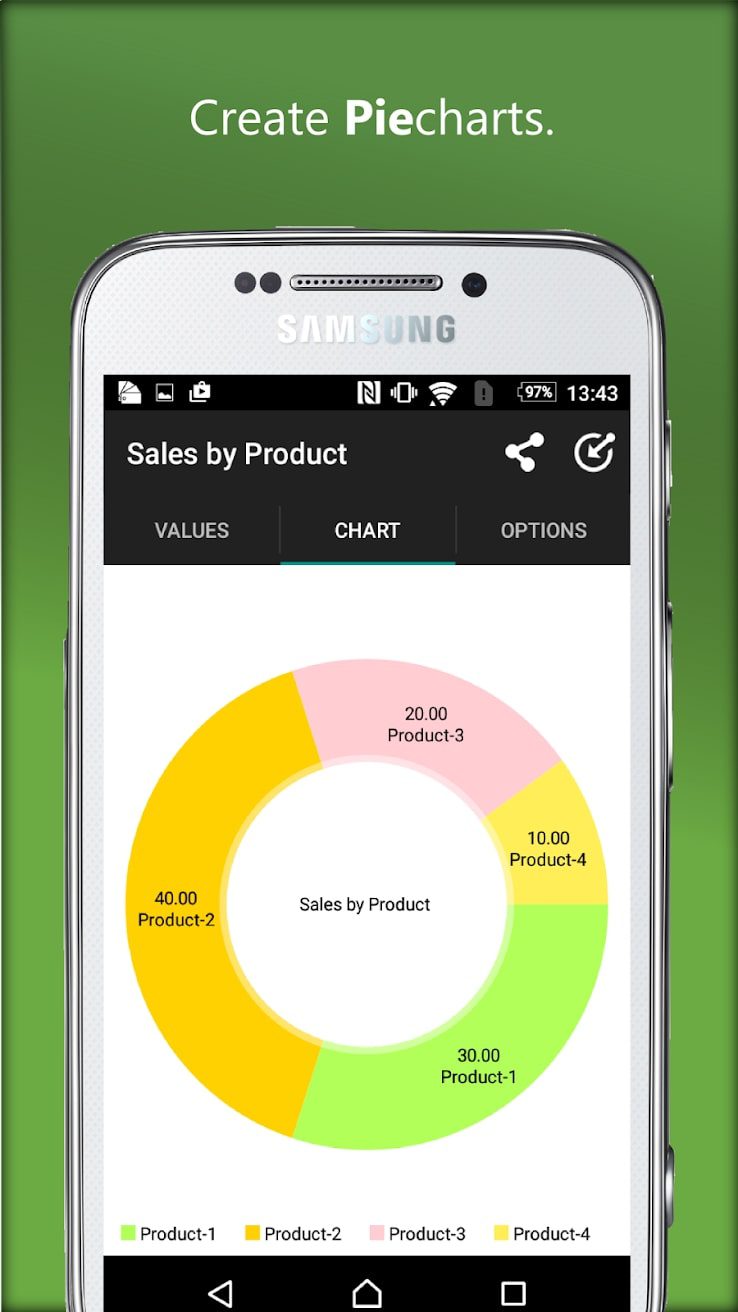
Recent app updates came with many useful features. Create widgets by selecting the appropriate size. Use trashbin to restore deleted charts.

EZ Charts
EZ Charts is an awesome tool for creating pie charts.
The first impression immediately rolls off the minimalistic logo design. It is matched by the interface of the app, as it is just as clear and accessible even for beginners.
First, you have to choose the type of chart. There are radar, line, bar, donut, and pie. Then enter all the data into a special table.
After that, the graph is automatically generated and you will have a preview. At this point, you can make your own changes.
Customize the colors for each scale. If you make them bright, the perception of the data will improve and the difference between them will be more obvious.
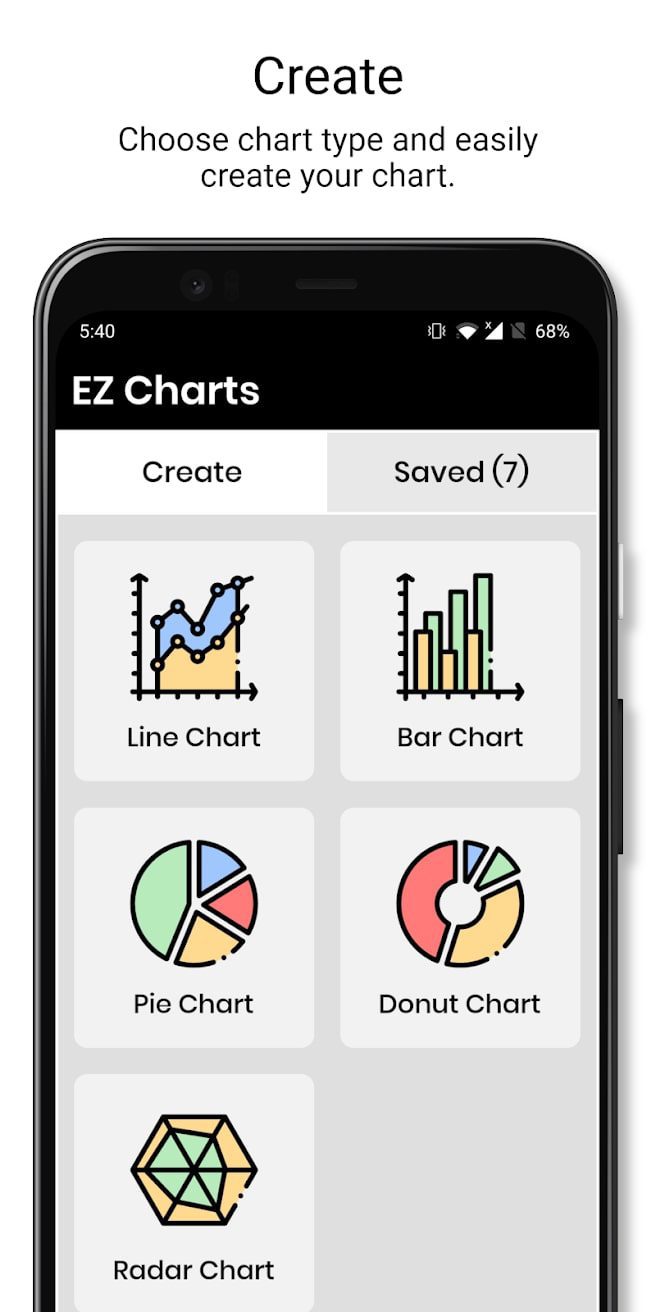
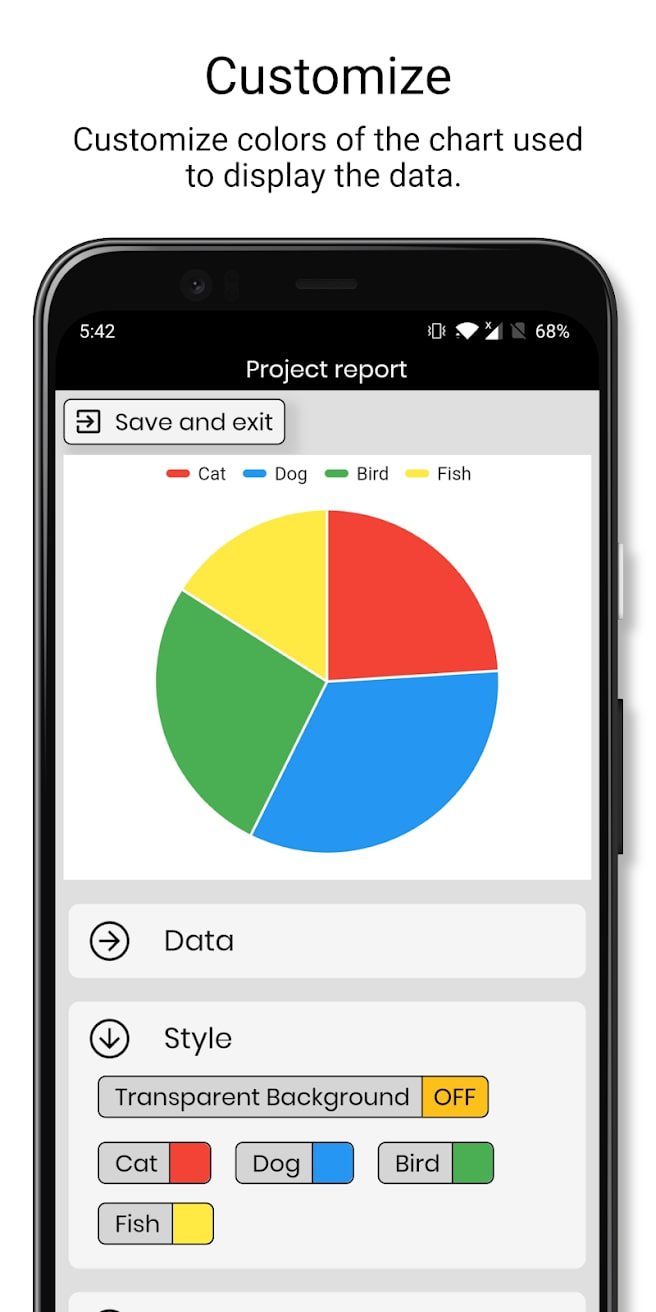
You can save the result as a picture in your phone’s gallery or share it with your friends. Charts are also saved directly in the app. They can be edited at any time.

Pie Chart Maker

The Pie Chart Maker app has a huge number of useful tools, as well as a user-friendly interface.
There are more precise settings, which you can see in the screenshots. Choose the colors for the sections. Enter the raw data into a table, which has functionality similar to the famous Excel program.
Charts are available for viewing in 2D and 3D views. You can also change the type to a donut. Adding text and a new legend is optional.
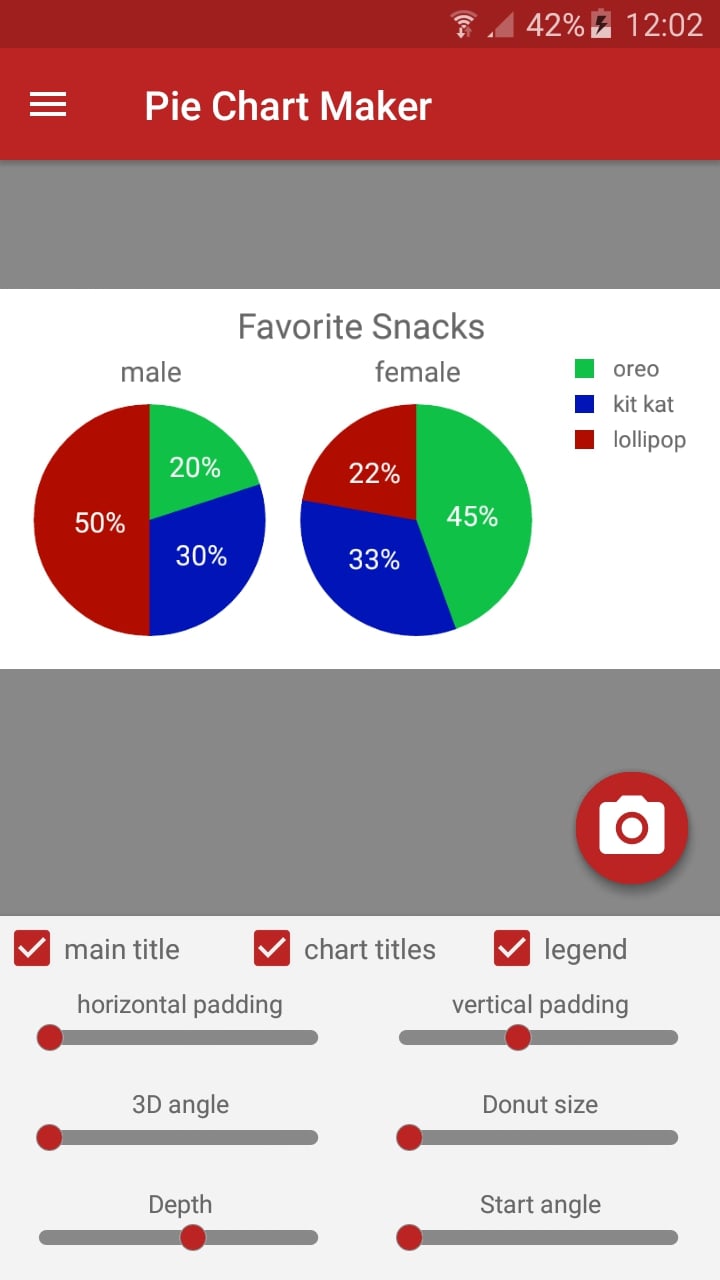
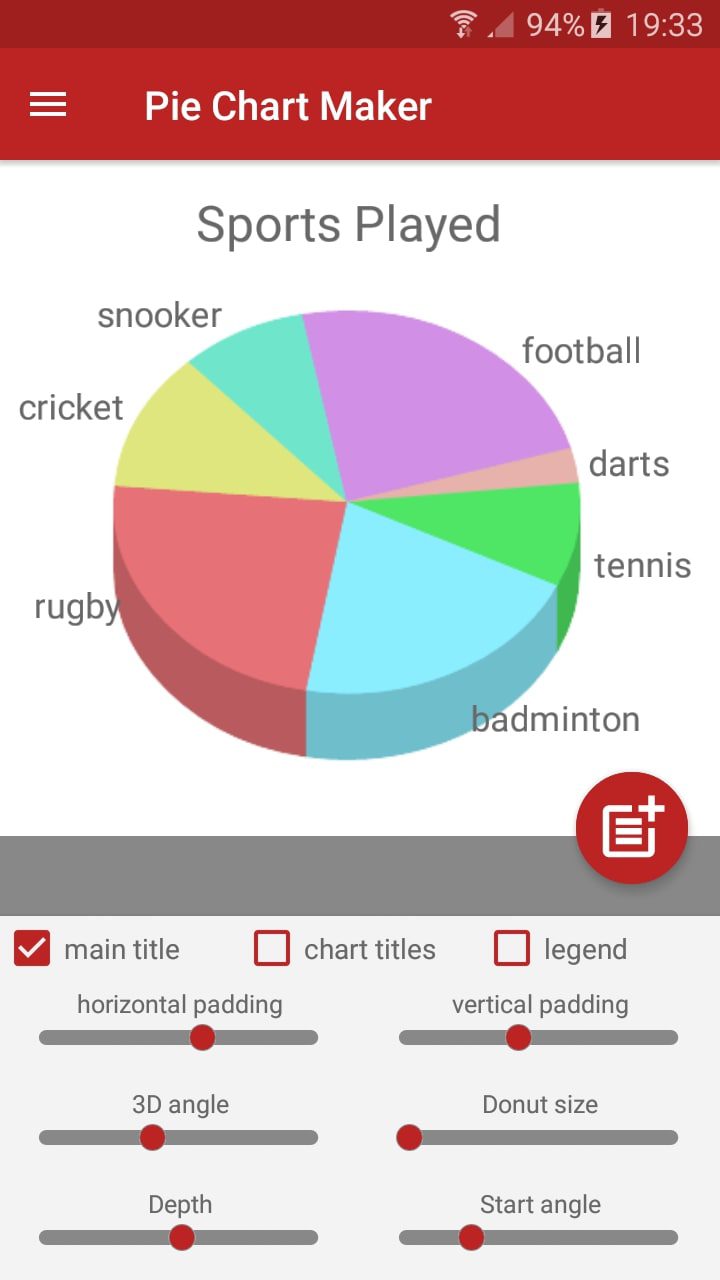
Insert percentages to get more accurate data. Up to 10 pie charts can be placed in one window. The result is available for saving in the image gallery.

You may also like: 11 Best Chores Organization Apps for Families (Android & iOS)
Chart Maker
The Chart Maker app is perfect for creating a basic pie chart to present necessary details. It takes you a few seconds to group all the information into one data source.
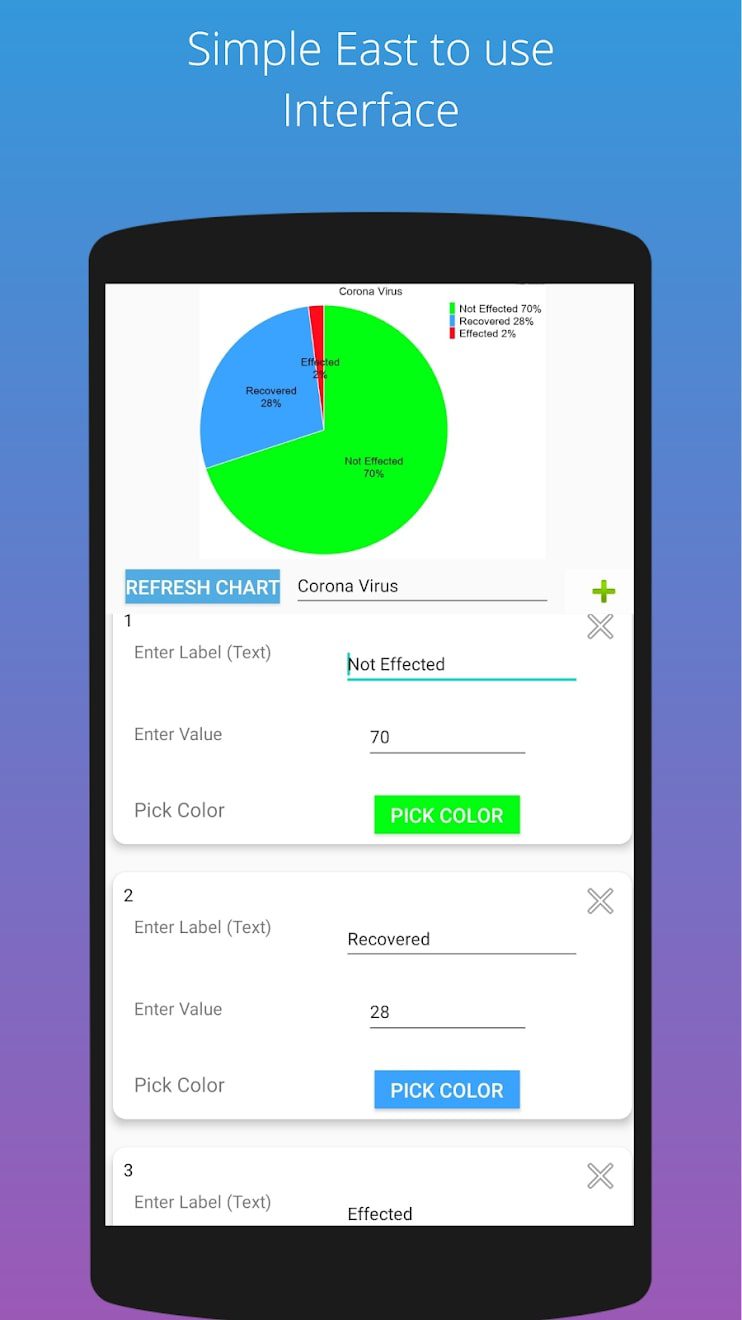
First, enter the source data and click on the refresh button. After that, you will see the converted pie chart. Values are available in decimal formats.
The diagrams are quite customizable. For example, you can set your own colors. For attachments, use photos from your phone’s gallery.
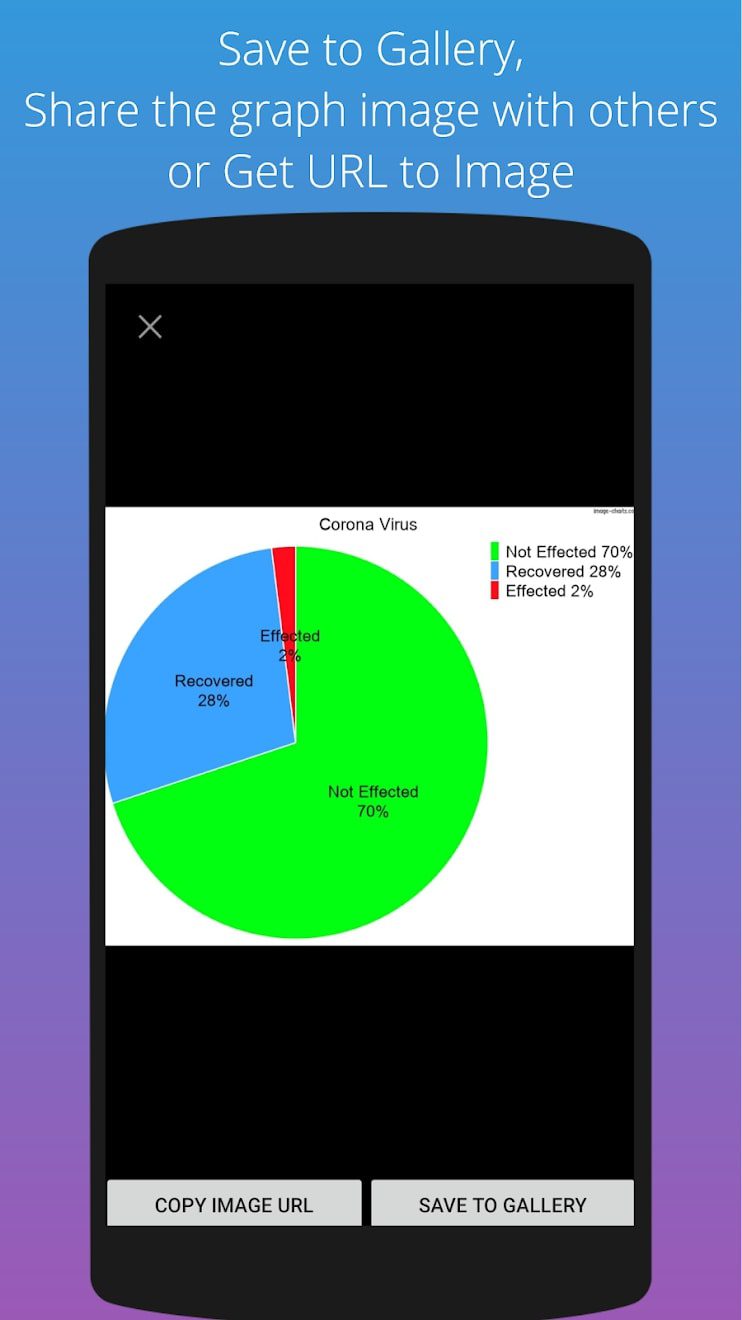
The result can be exported to the gallery. An image URL that you are to share with friends is also available.


